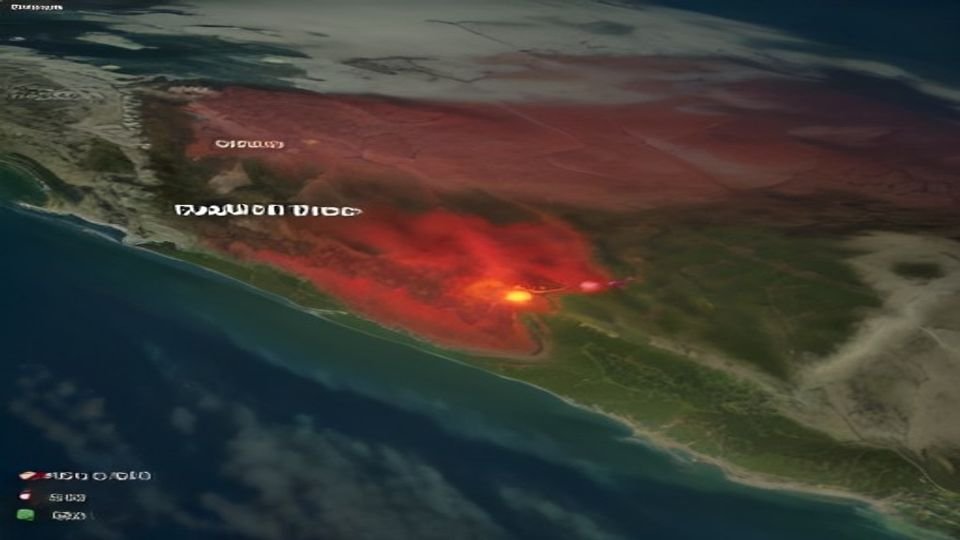
The Copernicus Browser, Europe’s free and open satellite imagery service, has added a new visualization layer designed to make wildfire tracking more accessible to the public. According to Ars Technica, the feature went live on August 4 and allows anyone to monitor wildfires using satellite data from the European Space Agency’s Sentinel-2 mission.
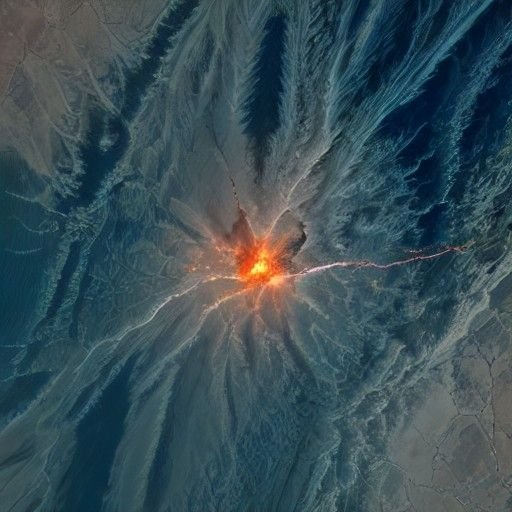
The Copernicus Browser provides free access to imagery from the Sentinel-2 constellation of three satellites, which operate as part of the European Union’s Earth observation program. These satellites have proven useful for wildfire monitoring, offering multi-spectral imaging at resolutions as detailed as 10 meters across visible light and near-infrared bands.
Previously, the Copernicus Browser offered 10 default visualization layers that users could customize using different combinations of spectral bands. The new dedicated wildfire layer simplifies this process by automatically highlighting key fire-related features. When users select the wildfire layer while viewing an affected area, active fires appear in white or yellow, burning vegetation displays in red, and burned landscapes show as dark brown or black.
The wildfire visualization enhancement originated from a JavaScript script written by remote sensing expert Pierre Markuse, according to reporting from Geovisualization. Markuse’s approach combines three specific data bands to reveal different aspects of wildfire activity. The script uses the red visible light band, the narrow near-infrared band to highlight differences between healthy and burned vegetation, and the short-wave infrared 2 band to detect burned landscape by measuring moisture levels in the soil.
The tool addresses a growing need for accessible wildfire monitoring resources. Communities worldwide face increasing wildfire threats, and satellite imagery provides a way for researchers, emergency responders, and the public to track active fires and assess damage across large areas in near-real time. By making this visualization readily available through a free, public platform, the Copernicus Browser expands access to Earth observation data that was previously more difficult for non-specialists to interpret.
Key facts
- Copernicus Browser added a new wildfire visualization layer on August 4
- Active fires appear white or yellow, burning vegetation shows red, burned areas display as dark brown or black
- The layer uses data from Sentinel-2 satellites, which provide 10-meter resolution imagery
- The visualization combines red light, near-infrared, and short-wave infrared bands to identify different wildfire stages
- The script was developed by remote sensing expert Pierre Markuse