
A new interactive visualization places S&P 500 companies inside proportional bubbles that reveal the relationship between market capitalization and workforce size.
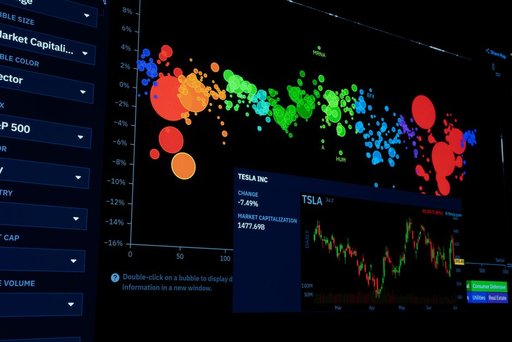
According to the source, each bubble represents a single company, with its area scaled to match the company’s market capitalization. Within each bubble, stick figures represent employees—one figure per employee. This visual approach makes density patterns immediately apparent: bubbles crowded with small figures indicate companies worth relatively little per worker, while large bubbles with sparse figures show high valuation per employee.
The visualization groups companies by sector, allowing viewers to compare how different industries balance market value with headcount. Because every stick figure is the same size, the density of figures within a bubble directly illustrates the ratio of employees to market capitalization—a measure of value generated per worker.
The data includes companies with at least a specified minimum number of employees and market capitalization threshold, covering the majority of the S&P 500. The source notes that a few companies with fewer employees—specifically mentioning Palantir and Welltower—are included as half-size figures to show them alongside larger peers.
Employee counts are sourced from each company’s latest annual report, which the creator acknowledges means the data lags by up to a year from the current date. This caveat is important for users seeking the most current employment figures.
The interactive design allows users to click on individual companies to view detailed information and to zoom in on smaller bubbles that might otherwise be difficult to see at full scale. This functionality makes the tool useful for exploring both broad sector-level patterns and specific company metrics.
The visualization serves as a tool for understanding corporate efficiency and value creation relative to workforce size, potentially useful for investors, job seekers, and researchers analyzing labor productivity across major U.S. corporations.
Key facts
- Each bubble’s area represents a company’s market capitalization
- Stick figures inside bubbles represent employees at a 1:1 ratio
- Figure density shows the relationship between employee count and market value
- The visualization covers most S&P 500 companies grouped by sector
- Employee data comes from companies’ latest annual reports and may be up to one year old
- Some smaller companies like Palantir and Welltower are shown as half-size figures